Support and resistance: trends, levels and breakouts
Support is a price where falling prices have stopped before because buyers stepped in. Resistance is a price where rising prices have stalled because sellers showed up. Add the trend, and you have the basics of reading any chart.
What a trend is
A trend is the general direction of price over many candles. In an uptrend, each high is higher than the last and each dip stops higher too. In a downtrend, highs and lows keep getting lower. When price moves inside a flat band, the market is sideways.
You can draw a trend line by joining the rising lows of an uptrend, or the falling highs of a downtrend. A clean break of that line is an early warning that the trend is losing steam.
What support and resistance are
Picture support as a floor and resistance as a ceiling. The more often price has turned at a level, the more traders watch it. In an uptrend, old ceilings often become new floors. In a downtrend, old floors often become new ceilings.
How to find support and resistance levels
- Start on a long timeframe. Open a weekly or daily chart first. Levels you see there are watched by far more traders than levels on a 5-minute chart.
- Mark the turning points. Look for prices where the market turned at least twice: recent highs, recent lows and the edges of sideways ranges.
- Check round numbers. Prices such as $100 for a share, $4,000 or $5,000 for gold, 1.1000 for EUR/USD or 150 for USD/JPY often act as levels, because many orders sit there.
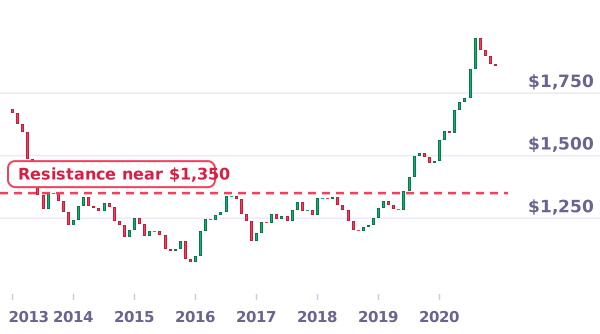
- Draw zones, not lines. Mark a band a little above and below each level. On the gold chart above, the ceiling was a zone from about $1,330 to $1,350, not one exact price.
- Keep only the clearest levels. Three or four strong levels help more than a chart covered in lines.
Why these levels work
- Memory: traders who bought at a level and saw it bounce tend to buy there again.
- Orders: buy orders, sell orders and stop losses pile up around obvious levels.
- Regret: people who missed a move often wait for price to come back to where it started.
When support becomes resistance
When price breaks clearly above resistance, that old ceiling often turns into the new floor. Traders call this role reversal. It works the other way too. Broken support often becomes resistance, because traders who bought there are now losing money and are happy to sell when price gets back to their entry.
Breakouts and fakeouts
A breakout is a strong close beyond a level, ideally with rising trading volume. A fakeout is a breakout that quickly reverses and traps the buyers who jumped in. Waiting for a candle to close beyond the level, and checking volume, filters out many fakeouts.

Levels are zones, not exact lines. Price often pokes a little past a level before it turns. Draw a band, not a hairline.
How to use levels with a stop loss
Here is how a trader might plan around levels, with simple numbers. A share has bounced three times from a support zone between $48 and $50, and resistance sits near $60. A trader buys at $51, puts a stop loss at $47, just below the zone, and a take profit at $59, just below resistance. The trade risks $4 per share to try to make $8.
- Put the stop loss beyond the zone, not exactly on the level, so a small poke does not close the trade.
- Take profit before the next level, because sellers often show up a little early.
- Check a longer timeframe first: weekly levels matter more than hourly ones.
- Never assume a level will hold. Decide your exit before you enter.

Careful with leverage. With CFDs and other leveraged products, a fakeout can close your trade at a loss before price turns back. Most retail CFD accounts lose money, so practise with pretend money first.
FAQ
What is support and resistance in trading?
Support is a price level where falling prices tend to stop because buyers step in. Resistance is a level where rising prices tend to stall because sellers appear. Traders use both to plan entries, exits and stop losses.
How do you find support and resistance levels?
Look for prices where the market turned several times, recent highs and lows, and round numbers. Start on a weekly or daily chart, mark each level as a zone, then zoom in.
What happens when resistance breaks?
It often becomes the new support, a pattern called role reversal. Some breakouts fail, so decide your exit before you enter.
What is a fakeout?
A breakout that quickly reverses. Price pokes through a level, falls back into the range and traps the traders who jumped in. Waiting for a candle to close beyond the level filters out many of them.
Which timeframe is best for support and resistance?
Levels on weekly and daily charts are watched by more traders, so they usually matter more than levels on a 5-minute or 1-hour chart.
Do support and resistance always work?
No. They mark areas where a reaction is more likely, not certain. Always plan your exit.
Sources: Chart data: gold, monthly average prices (World Bank). Educational content, not financial advice.

Find support on real charts
Tap where you think support is, then watch real prices bounce or break through.
Play Level LinesKeep reading
 How to read a candlestick chartRead candlestick charts step by step: open, close, high, low, wicks, timeframes, trends and three common patterns, with real oil, gold and yen charts.Read the guide
 How to choose a safe, regulated brokerHow to check a broker's licence with the FCA, ASIC, CySEC, SEBI, OJK or another regulator, which protections cover your money, and the red flags of scams.Read the guide
 What is inflation? How it is measured and what it does to your moneyInflation for beginners: how the CPI basket works, central bank targets, why prices jumped in 2022, real returns and what inflation does to savings.Read the guide